Howard Lau, Investor, Coach, Speaker
Menu
Cincinnati Multifamily Market Report
Multifamily Cincinnati Metro Area
Supply Wave Places Pressure on Vacancy, but Cincinnati Maintains Regionally Low Availability
Vacancy rises to a more historically consistent rate
At the end of March 2023, Cincinnati had the second-lowest vacancy rate among major Midwest markets. This ranking corresponded with the metro recording the region’s fastest pace of rent growth over the past 12 months. Despite conditions being regionally tight, unit availability is still higher than 12 months ago as recessionary fears, along with the rising cost of renting, have encouraged many individuals to split costs with roommates. These factors lifted vacancy to levels typically observed before the pandemic. However, in the first quarter of 2023, some areas still logged sub-3 percent vacancy. This list included West Cincinnati, the metro’s largest submarket by inventory, and Southeast Cincinnati, a locale of locally discounted rent.
Developers focus on a trio of submarkets
Upward pressure on vacancy during the remainder of this year will predominantly stem from record supply additions. As of March, over 6,700 units were underway in the metro. Nearly half of these rentals are slated to come online in Butler County, North and North Central Cincinnati. All three of these areas noted vacancy over 4 percent in March 2023, and additional supply will likely push availability further away from this threshold. Nevertheless, North Central Cincinnati appears best-positioned to receive an inflow of luxury units. Here, Class A Heightened supply additions will place vacancy is tied for the lowest in the metro, signaling new apartments upward pressure on vacancy, lifting are warranted. This dynamic may mitigate a portion of the supply wave’s impact on overall vacancy.
Multifamily Cincinnati Metro Area
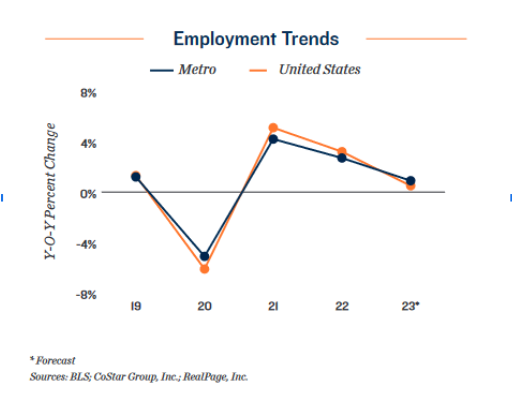
Employment:
By the end of 2022, total employment in Cincinnati had surpassed the pre-pandemic high recorded in February 2020. Positive growth will continue this year, albeit at a more moderate pace, with companies expanding headcounts by 0.9 percent.
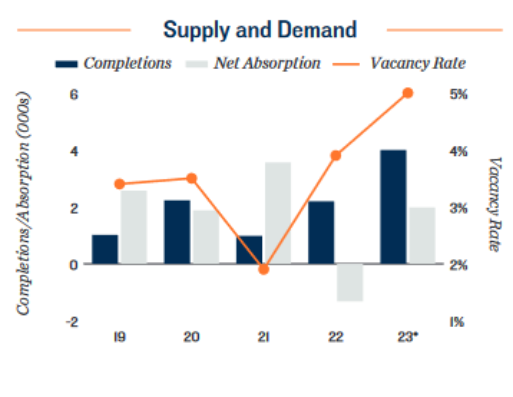
Construction:
Total inventory will advance by 2.4 percent during 2023, as this year’s delivery volume represents the largest annual total since at least 2000. Renters, however, will absorb a net of nearly 2,000 units, indicating new rentals are fairly well-received.
Vacancy:
Heightened supply additions will place upward pressure on vacancy, lifting the rate to 5.0 percent. Availability, however, will remain 100 basis points below the metro’s long-term average,signaling historically solid demand.
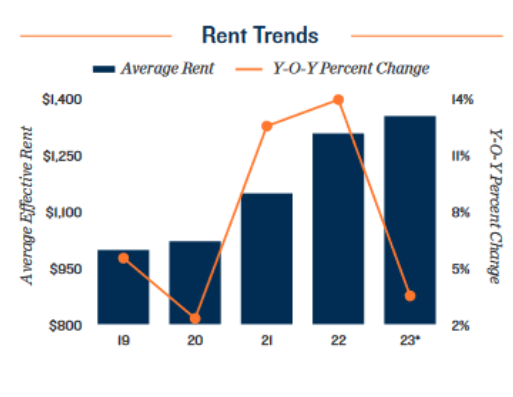
Rent:
Among Ohio’s three major markets, Cincinnati will maintain the highest average effective rent at $1,352 per month, beating out Columbus for the second straight year. From 2019 to 2023, the mean effective rent will have grown by over 35 percent.
1Q 2023 - 12-Month Period
Construction
2,596 units completed
Apartment inventory increased by 1.6 percent in the 12-month period
ending in March, its fastest pace since 2016.
In the first quarter of 2023 alone, around 540 units came online. Developers became increasingly active in the metro, after Cincinnati noted a sub-2 percent vacancy in 2021.
Vacancy
250 basis point increase in vacancy Y-O-Y
Elevated delivery activity and negative net absorption at the end of 2022
combined to drive vacancy upward, placing the rate at 4.3 percent at the
onset of April.
In March 2023, Southeast Cincinnati had the lowest vacancy rate in the
market as completions here were sparse.
Rent
11.4% increase in the average effective rent Y-O-Y
Double-digit rent growth continued over the trailing 12-month period pre-
ceding April. Cincinnati was the only major Ohio market to register such
an increase during the period.
The average effective rent sat at $1,315 per month entering the second
quarter, a record mark among the trio of Ohio metros.
Investment Highlights
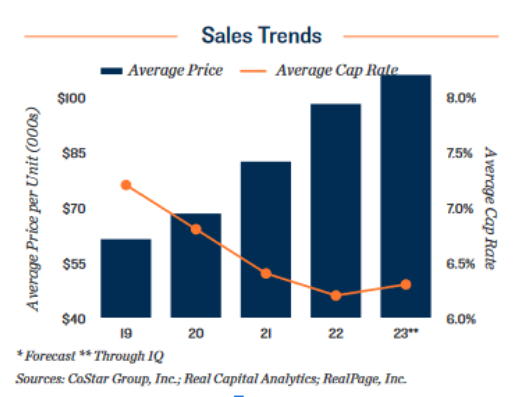
Contrasting many other major U.S. markets, transaction velocity in Cincinnati stayed consistent through the second half of 2022. While deal flow was weaker than the high recorded, last year’s transaction total was in-line with historical figures. Investor competition for available listings contrib-uted to the average sale price surging in the yearlong span ended in March,bringing the mean price point to over $100,000 per unit for the first time.
Despite rising entry costs, Cincinnati maintains the third-lowest average pricing in the Midwest, paired with one of the highest mean cap rates at 6.3 percent. This combination may create an opportunity for active out- of-market investors during a period of mounting capital costs and rising vacancy — specifically those with a higher risk tolerance.
Northern Kentucky noted an uptick in deal flow last year, particularly in Kenton County, as mid-tier assets traded below the metro’s average price point. Investors targeting discounted entry costs may increasingly turn to this area, as fewer than 150 units were underway across the area as of March. Elsewhere, neighboring Campbell County also has a moderate construction pipeline, potentially aiding long-term property performance and buyer sentiment in the submarket.
The information contained in this report was obtained from sources deemed to be reliable. Every effort was made to obtain accurate and complete information; however, no representation, warranty or guarantee, express or implied, may be made as to the accuracy or reliability of the information contained herein. Metro-level employment growth is calculated based on the last month of the quarter/year. Sales data includes
transactions sold for $1 million or greater unless otherwise noted. This is not intended to be a forecast of future events and this is not a guarantee regarding a future event. This is not intended to provide specific investment advice and should not be considered as investment advice. Sources: Marcus & Millichap Research Services; Bureau of Labor Statistics; CoStar Group, Inc.; Real Capital Analytics; RealPage, Inc